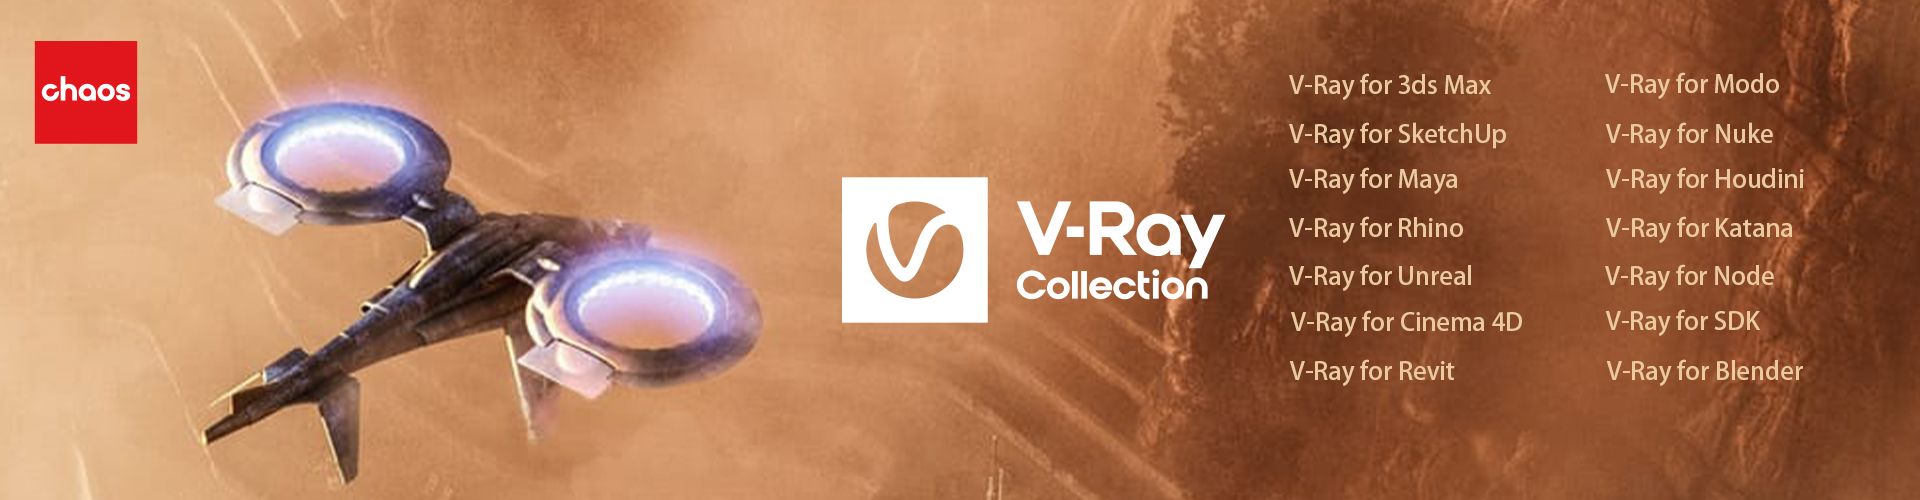
Orion Application Performance Monitor (APM) extends Orion NPM’s powerful monitoring capabilities to applications and servers, giving you visibility into the performance of applications and the underlying operating systems and servers they run on.
When business-critical applications aren’t running at peak performance – or even worse, aren’t running at all – your help desk queue starts growing exponentially, along with the angry phone calls. As the trouble tickets mount, it can be a mad dash to troubleshoot the root cause of the issue. As the network engineer, usually the buck stops with you, regardless of whether the problem stems from the application, the server, or the network.
Orion Application Performance Monitor (APM) extends Orion Network Performance Monitor’s powerful monitoring, alerting, and reporting capabilities to applications and servers, enabling you to confidently say “It’s not the network!” (or meekly admit, "It is the network.") Finally, you can get the visibility you need into the performance of applications and the underlying operating systems and servers they run on. Orion APM delivers a one-stop shop for monitoring network, application, and server data through a single, intuitive pane of glass, enabling you to quickly isolate performance issues with business-critical applications – before they affect your end users.
Application Performance Monitor Highlights:
- Quickly determine the root cause of application performance issues with a unified view into network, application, and server monitoring data
- Monitor a wide range of server and application types, including operating systems, web servers, URLs, backup applications, databases, directories, application servers, messaging servers, network services, and application ports
- Begin monitoring your mission-critical applications in just minutes with APM’s out-of-the-box, agentless monitoring templates
- Create custom application monitors quickly and easily, and share templates and scripts on Thwack, SolarWinds’ online community
- Get at-a-glance, unified visibility into application performance via the intuitive Orion console and its easy-to-use charts, graphs, tables, alerting, Top Ten lists, and reporting views
- Simulate and measure Quality of Experience (QoE) with User Experience Monitors to find and fix issues before they affect end users
- Leverage open-source Nagios® scripts to save time, facilitate migration to APM, and expand monitoring of Unix and Linux systems
- Monitor Windows, Unix, and Linux servers by tracking key performance statistics, such as running services, process availability, memory usage, CPU utilization, and response time
- Point and click to remotely monitor WMI performance counters, ensuring quick identification and resolution of application issues
|